Highlighting Energy Conservation

SustineoCorp/APPIC
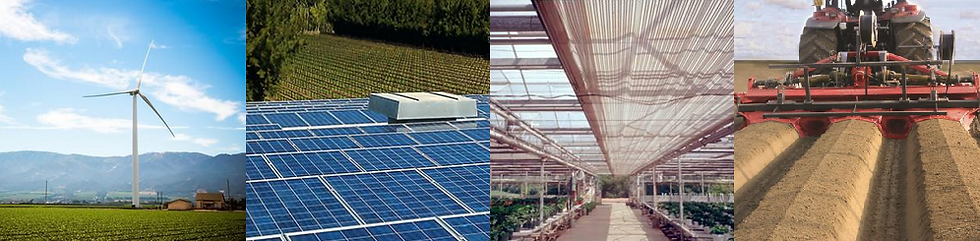
Energy conservation comes in large part from integrating several other aspects of conservation in agricultural practices such as water-saving devices and techniques or soil management practices. It is understood that using less water on a farm will require less energy use for most operations, given the electricity necessary to power irrigation pumps. Other obvious applications include production and processing facilities, and reducing fuel use or using alternative fuels for field machinery or for transporting agricultural products. Energy conservation also has other beneficial effects, such as wildlife conservation. This feature showcases opportunities that growers and the agricultural industry have to further energy conservation and complement sustainability goals in Monterey County.
Fresh Plaza
Extension
Veda Farming
Promoting agricultural climate resiliency
High certainty exists among leading scientists that greenhouse gas emissions from human-related activities are the primary driver of climate change. The vulnerability of Monterey County’s largest economic sector, agriculture, to the impacts of climate change depends on its exposure and sensitivity to those impacts. Vulnerability can be lessened through improved resilience, achieved by undertaking practices that enable mitigation of or adaption to climate impacts.
The specific impact is difficult to predict, but a few things can be inferred from climate science that will likely affect this region. Increases in carbon dioxide in the atmosphere would increase the amount of biomass in crops, whether above or below ground, which would increase carbon levels in soil. Warmer weather will likely lengthen growing seasons, allowing for more carbon input into soils, but could also speed up decomposition and reduce carbon inputs by shortening crop life cycles. By the same token, longer growing seasons likely means more pests. Either way, it is likely that biological productivity in the soil will increase, and thereby increase soil carbon. In addition, both droughts and floods are likely to increase in frequency and severity in a warmer future climate (IPCC 2007).
Agriculture accounts for an estimated 8% of California’s 450 million-plus metric tons of carbon dioxide equivalent in annual greenhouse gas emissions. Monterey County is practically devoid of activities that contribute over 60% to statewide agricultural greenhouse gas emissions such as dairy cattle (57%) and rice cultivation (3.5%), but potential remains for improved management of soil, manure, livestock, fuel, and biomass to further reduce locally-sourced emissions. Although Monterey County has minimal dairy operations, cattle grazing is abundant. Direct and indirect emissions from soil management contribute to a remaining quarter of agricultural emissions, manure and livestock to 13%, and biomass management to less than 1%. Taken separately, agricultural fuel use contributes 0.25% to total emissions in the state. Almost two-thirds are attributed to distillate fuels such as diesel. Natural gas, gasoline, and ethanol contribute almost 19%, almost 14%, and less than 0.01%, respectively (CARB 2014).
Several agricultural practices can reduce emissions of the greenhouse gases carbon dioxide, nitrous oxide, and methane.
Calibrating the timing, rate, placement, and amount of fertilizer in applications based on actual crop nutrient requirements enables growers to avoid unnecessary leaching of nitrates into groundwater or the release of nitrogen fertilizers as nitrous oxide into the atmosphere (IPCC 2007). This can be achieved through precision agriculture, slow- or controlled-release fertilizer applications, and by applying nitrogen fertilizer prior to plant uptake when it is least susceptible to loss (Robertson 2004; Dalal et al. 2003; Paustian et al. 2004).
Introducing legumes into pastures can also reduce nitrous oxide emissions and increase carbon storage, but ranchers should first consider potential ecological impacts of introducing new species to the grassland (Soussana et al. 2004; Sisti et al. 2004; Diekow et al. 2005; IPCC 2007).
Improved crop varieties and extending crop rotations which include perennial crops can increase soil carbon storage (West and Post 2002; Smith 2004, a; Lal 2003, 2004; Freibauer et al 2004).
Carbon stores in agriculture. Source: ATTRA, NCAT, 2009, Agriculture, Climate Change, and Carbon Sequestration, accessed 10 Feb 2015.
By not over-baring soil and by restoring perennial crops that place more carbon in the soil, ranchers can also increase soil carbon (IPCC 2007).
Appropriate stocking densities on grazed lands, feed diversification, and managed grazing can all mitigate a low amount of carbon emissions (IPCC 2007).
Improving the quality of forage in pastures on rangeland will improve cattle’s productivity and reduce emissions. Grasses that cattle digest more easily reduce the proportion of energy lost as methane through enteric fermentation taking place in their digestive tracts. This also reduces the amount of nitrogen in the excrement, reducing nitrous oxide in manure (Leng 1991; McCrabb et al. 1998; Alcock and Hegarty 2006; Clark et al. 2005).
Fire prevention and improved prescribed burning can mitigate a small amount of carbon emissions (IPCC 2007).
Manure management can also mitigate a small amount of nitrous oxide emissions (IPCC 2007).
Conservation tillage in Monterey County. Source: Jackson et al. 2002 (cited in Soil Conservation Highlights on our website).

Reduced tillage can reduce nitrous oxide emissions depending on soil and climatic conditions. It can also require fewer passes through the field, reducing carbon dioxide emissions from fuel use (IPCC 2007; Marland et al. 2003; Koga et al. 2006).
Mitigation potential exists in soil carbon sequestration. Capturing carbon in soil better enables soils to hold moisture and withstand erosion. It can also help crops better withstand more frequent and severe droughts and floods. This practice is incentivized through carbon offsets, or payments for sequestering carbon in soils through a carbon market, such as the Chicago Climate Exchange.
Planting cover crops can increase carbon in the soil, and, in the case of legumes, extracts leftover nitrogen available to plants, reducing nitrous oxide emissions and nitrogen fertilizer expenses.

Cover crops between rows in a vineyard. Source: Smith et al. 2008 (cited in Soil Conservation Highlights on our website).
The following resources provide more information on interactions between agriculture and climate change.
Distributed generation and net metering
Electricity produced at or near the point where it is used is known as distributed generation. Excess energy generated by renewable sources such as wind, solar, biomass, and geothermal power can feed into the electric grid and reduce the use of fossil fuels in electricity generation. Since this can reduce greenhouse gas emissions and helps utilities offset peak production, various local, state, and federal rebates and incentives are available to residents using renewable energy for distributed energy generation.

Centralized power generation vs. distributed generation (DG). DG enables multiple sources of energy generation to meet energy needs. Energy can be generated and used onsite and excess energy can help power the electric grid. Source: Green Business Guide South Africa, 1 Dec 2014, Distributed generation key to SA's energy, accessed 11 Feb 2015.
Under net energy metering (NEM), energy system owners can offset the cost of their bill with the electricity they add to the grid. For example, a rooftop solar system could generate more electricity than the home uses in the day. With net-metering, the meter will run backwards to offset the cost of utility-provided electricity used when the home uses more electricity than the private system produces (e.g. at night). Agricultural and Demand Rate customers with distributed wind or solar generation can enter into PG&E’s Expanded NEM program to receive such benefits. California’s investor-owned utilities (e.g. PG&E) can apply net metering billing policies to solar energy systems that generate 1,000 kW or less at full capacity (DSIRE 2014).
The following resources provide more information about net metering opportunities available to local residents for using forms of alternative energy for distributed generation, especially solar.
-
State maps showing incentives and rebates for solar, Database of State Incentives for Renewables & Efficiency (DSIRE)
-
Guide to federal programs, Energy.gov
-
Net metering description, Solar Energy Industries Association

Net Metering with PG&E. A portion of the bi-directional meter runs backward for energy generated on site to use as a credit towards costs for electricity supplied by the utility's electric grid. Source: Stevens, L., 18 Jun 2012, "Aggregate metering seen as a boost to renewable energy projects", The North Bay Business Journal, accessed 11 Feb 2015.
Wind Energy
While the use of wind energy may be limited due to constraints in Monterey County, wind as an energy resource is still highly beneficial and power generation from wind energy may expand locally.
Wind energy is a fairly efficient and more eco-friendly energy option compared to other fuels, even including other renewables. Over its lifetime (including manufacturing, installation, operation and maintenance, and dismantling and decommissioning), wind energy generation produces few greenhouse gas emissions. Coal, a nonrenewable resource, emits 1.4-3.6 pounds of carbon dioxide equivalent per kilowatt hour (lbs. CO2e/kWh). In contrast, wind emits only .02-.04 lbs. CO2e/kWh. Solar emits .07-.2 lbs. CO2e/kWh, geothermal .1-.2, and hydroelectric .1-.5 (IPCC 2011). Wind energy is also quite efficient compared to other renewables. Only geothermal and small scale hydro-electric projects (which as noted produce more emissions) generate more electricity per kW of capacity than wind in California (derived from CEC 2014).
Wind energy has become increasingly viable owing to reduced cost and increased efficiencies. Over the past decade, wind power capacity in the U.S. increased 30% annually (DOE 2015). Technical improvements paved the way first, such as using new materials in turbine components, designing advanced blades to produce 30% more energy (raised the industry standard), and using more energy-efficient drivetrains in turbines that reduced manufacturing costs. Newer technologies are continuing to reduce the cost and improve efficiencies. These include a sweep twist adaptive rotor (STAR) blade system that is optimized for a wider range of wind speeds, and plug-and-play turbines that feature integrated inverters and controls, making it easier to install, operate, and maintain compared to comparable turbines (DOE 2012). Today's operating capacity of renewable energy projects in California is 21 GW, composed of 18.8 GW of wholesale renewable energy (sold to a utility or marketed for resale) and 2.2 GW of self-generation. Of the 18.8 GW of wholesale renewable energy, 7.1 GW comes from wind energy (CEC 2014). Increased adoption of wind energy enables it to become more cost-effective. The price per kWh for wind energy generation in California is almost four times cheaper today than it was in 1980 (CEC: see link below).
Though wind energy is increasingly efficient and viable, its potential is not well-understood for California agriculture, likely due to high land rents being a major constraint. This could especially be the case in Monterey County. Some of the best wind resources in the U.S. are on agricultural lands, and farmers have many options to take advantage of wind energy such as: leasing land to wind developers; using the wind to generate power for their farms; or distributed generation for utilities. In many cases, growers can plant very near the base of the turbine, making sure it takes up little additional acreage (UCS 2003).
Given the high rents for agricultural land in Monterey County, a main consideration is economic. The average windfarm in California uses 17 acres of land to produce 1 MW of electricity, but agriculture and cattle grazing often occur simultaneously. (CEC: see link below). The bulk of wind electricity generated in the state is from large scale windfarms in the Bay Area and Southern California. It’s not likely that many (if not any) wind projects on farms in the state use close to 17 acres aside from grazing lands. Most growers would want net profit (income and expenses) generated from wind power to at least equal or be greater than the loss of net profit from crops grown on land to be taken out of production. This might not often be the case, but for agricultural processing facilities, wind may be worth it.
Despite constraints, wind power already exists in Monterey County. One grower leases a 350’ wind turbine on property owned by the City of Gonzales. The wind turbine powers 50% of the grower’s 280,000 square foot vegetable processing plant. The grower purchases power from the turbine’s owner at a rate lower than current utility rates. The turbine can reasonably produce about 1,250,000 kilowatt hours per year (kWh/y), enough to power approximately 350 homes, given the often 12 hours of wind in the Salinas Valley during the day. The lease with Foundation Windpower runs for 25 years. The turbine showcases how agricultural operations can be incorporated into local sustainability goals, and is part of the Gonzales Goes Green city sustainability initiative. In fact, the turbine accounts for an 80 percent reduction in the city’s carbon footprint for its commercial and industrial sectors (Leyde 2014).

Top: Estimated capacity of wholesale renewable resources in California. Middle: Estimated generation from wholesale renewable resources. Note that the portions for wind, biomass, and geothermal increase going from capcacity to generation, indicating relative efficiency. Source: CEC 2014: 1-2.


Turbine owned by a local grower. This turbine, one of the first to be installed in the Salinas Valley, powers half of the grower's processing facility. Source: Fresh Plaza, 20 Nov 2014, Wind turbine in motion at Taylor Farms Gonzales.
Farmers considering wind power generation must also determine if a project would be suitable on their land given potential impacts to wildlife. Siting turbines should be done to avoid diminishing the integrity of wildlife and ecosystems. For example, the above turbine in the Salinas Valley is near the flight path of the endangered California condor. An environmental assessment determined that risk to the condor population was possible, but not likely, since few condors were detected in areas near the turbine (HT Harvey and Associates 2007). This is often a more serious issue when siting larger wind projects. Indeed, this agency wants to encourage growers to undertake smaller-scale wind projects that support the farm instead of larger commercial applications, especially in light of the California condor's endangered status and distribution throughout locations in Monterey County.
-
Overview of Wind Energy, California Energy Commission (CEC)
-
Regulations for commercial and non-commercial wind energy conversion systems, Monterey County Code of Ordinances 21.64.120
-
Wind Power statistics, US Department of Energy (DOE), 2012
-
Wind turbine going up in Gonzales, Leyde, 2014
-
Presence and Movements of California Condors near Proposed Wind Turbines, HT Harvey and Associates, 2007
Solar Energy
A variety of cost-effective, on-farm solar energy applications enable farmers to cut energy costs and reduce greenhouse gas emissions. Rapid recovery of higher initial costs through incentives plus savings on both fuel and maintenance make solar an attractive alternative energy generation system. Solar panels are the most common way to produce on-farm renewable energy (Xiarchos and Vick 2011). Several reports even announce that by 2014 solar had become cost-competitive with utility-provided electricity (Cardwell 2014), paving the way for further adoption of the technology. In addition to today's numerous applications, we can reasonably expect farmers to continue to adopt solar energy to power increasingly more uses on the farm. These systems can be roof-mounted or installed on the ground, taking up no or very little additional high-value agricltural land when carefully sited.
Photovoltaic electricity
Solar electric systems use photovoltaic (PV) cells that convert sunlight into direct current (DC) electricity. PV systems produce DC power, so DC output is converted to alternating current (AC) by an inverter for powering many electronics. The average size of a solar energy system for agricultural applications nationwide is 4.5 kilowatts (kW). Over 80% of modules are made of crystalline silicon (Solarbuzz 2010), which is more efficient, enabling farmers to use fewer of them to power operations. These modules can last up 30 years and some even have 20 year warranties. They decline in efficiency at a rate of 1% per year. In contrast, thin film modules decline 20% in the first year, then 1% annually thereafter. Crystalline silicon is also more durable than thin film. However, amorphous silicon (type of thin film) modules use 100x less silicon in manufacturing, making them cheaper. Thin film modules generate higher power, can be more efficient in cloudy conditions, and can more easily be integrated into buildings (Xiarchos and Vick 2011). The growing business of solar panel recycling further speaks to the solar industry’s claims of job growth.
Solar arrays can be stationary or track the sun to enhance efficiency. In the northern hemisphere, arrays face south. Tracking arrays can capture 25-40% more energy in some cases, but are not economical for systems under 500W of capacity. Non-tracking arrays are angled equivalent to the location’s latitude. To optimize efficiency as the seasons change, system owners can either (a) tilt arrays 10 degrees higher than the location’s latitude in fall and winter, and 10 degrees lower than the latitude in spring and summer; or (b) tilt them equal to the location’s latitude in spring and fall, tilt them 15 degrees higher in winter and 15 degrees lower in summer (Xiarchos and Vick 2011).
In grid-connected systems, excess energy is fed back into the grid, and when insufficient electricity is generated from the sun, electricity is drawn from the grid. Systems generally range from 1-100kW of capacity. Today, most solar energy systems are grid-connected (Xiarchos and Vick 2011).

Above: Thin film modules. Source: The Solar Expert, 31 Oct 2013, Thin Film Solar Panels--Pros and Cons? Accessed 11 Feb 2015.
Below: Crystalline silicon modules. Source: Photonics, 9 Nov 2012, ITC Affirms Tariffs on Solar Panels from China, Accessed 11 Feb 2015.

Off-grid systems generally require batteries for storage, so they tend to be more expensive. These systems rely solely on electricity generated onsite to meet its power needs. Nearly all batteries are known as lead-acid type. More expensive is nickel-cadmium and nickel-metal hydride. Batteries can last 5-10 years if they are not over-charged or excessively discharged and properly maintained. Most off-grid systems have a 1-2kW capacity and several days of battery storage, serving DC loads. An inverter is required when AC power is needed (for most electronics). A backup generator can supplement power needs for off-grid systems, and can be even be powered by another renewable energy source such as wind or bioenergy (Xiarchos and Vick 2011). Off-grid solar is likely to be at least 20% cheaper than other energy alternatives for off-grid applications (Solarbuzz 2010a).
PV is most cost competitive with other small generating sources in applications where a small amount of electricity has a high value. It is also cost-effective in locations where utility-generated power is unavailable, impractical, or too costly. PV systems can be cheaper than installing or extending power lines which require a transformer for voltage step down. Off-grid systems are often practical for powering applications under 1kW such as lighting, fencing, and water pumping for livestock and irrigation (Xiarchos and Vick 2011).
The largest percentage of identified on-farm energy use involves motors, leaving a lot of potential for using PV-powered irrigation. Water pumping is one of the main off-grid PV applications for farms. These systems do not require battery storage, since excess water can be pumped into tanks and stored for irrigation. They can be the most cost-effective water pumping option in locations without existing power lines. The extra cost for the initial purchase can be recovered in 5-10 years or less through maintenance and fuel savings. The size and cost of the system depends on the solar resource, pumping depth, water demand, and system purchase and installation costs (Xiarchos and Vick 2011).
Lighting, electric fencing, battery-charging, and feeder/sprayer/ sprinkler control are other PV applications that can be easily maintained. Fence chargers replace grid connection or a battery that must be recharged by a fossil-fuel-powered generator. A lighting system is comprised of the solar panel, a battery, a charge controller, and an efficient DC lighting fixture. Solar pond aerators oxygenate ponds, improving water quality by reducing biochemical oxygen demand (BOD). Gate openers can be cost-effective over 1,000 feet from grid power. PV panels mounted on vehicle dashboards can also feed a trickle charge to batteries in seldom-used vehicles or farm equipment. A PV-powered rooftop fan can provide ventilation or air flow for cooling in livestock buildings and sheds (Xiarchos and Vick 2011).

Solar PV can also be used on ranches to operate gates using a controller. Source: Simply Efficient website, accessed 11 Feb 2015.
Solar heating
Solar heating applications are limited in Monterey County to heating and ventilation of buildings. Radiant heating systems that send heat through floors, walls, or via radiator can also be solar-powered. Less common is air heating with a heat exchanger. A new application is solar-powered air conditioning (Xiarchos and Vick 2011).
Solar hot water collectors range depending on temperature needs. Unglazed collectors are used for low temperature needs, glazed collectors are used for medium temperatures (86-158 deg. F) and vacuum tubes are used for higher temperature needs and for cooling. Vacuum tubes are an effective alternative to space heating, especially in cooler regions. Unglazed and glazed collectors are used for air heating. Glazed collectors can be used to reduce the use of natural gas or electric heat commercial buildings, or factories. Unglazed perforated plates/transpired plates are very efficient and are most commonly used for heating ventilation air in large spaces (Xiarchos and Vick 2011).
Local solar energy examples
A vintner uses what is known as a Paso Panel in combination with other irrigation managment tactics to determine irrigation need in the vineyards he manages. The Paso Panel consists of flexible solar panels attached to an electric meter that measures the voltage from solar energy on the vine. Plugging in the readings to a formula that measures evapotranspiration, the vintner can determine the amount of shade on each vine (Pomo 2014).
They are especially useful for wineries and agricultural buildings. One winery took advantage of government rebates to install 4,400 solar panels on site which power 78% of its facilities (Miller 2014). Another wine producer plays stag (male deer) distress calls through solar-powered speakers at the edge of the vineyard to ward off deer (Mitchell 2014).

Solar PV arrays on rooftops supply 78% of a local winery's energy needs.
Source: SustineoCorp/APPIC, 11 Jun 2014, Soledad, CA 1.2 MW, accessed 11 Feb 2015.
Another vintner contracted a solar company to build a small-scale solar park to power irrigation pumps in the vineyard and it hopes up to 80% of their winery. The solar park consists of two sets of arrays on separate hillsides, with each surrounded by vineyards to minimize visual impacts and disturbance to wildlife. The 433.5 kW system is the first net metered project of its size (GP Joule 2014; Fitchette 2015).

Solar park powers irrigation in vineyard and large portion of winery, and minimizes disturbances. Source: GP Joule 2014.
Farmers and communities may become entangled in the ongoing debate between renewable energy projects and conservation of agricultural lands. For example, Apple Inc. recently gained approval to construct a concentrated solar power (CSP) project near Parkfield in southern Monterey County amid residents' concerns. Though potential exsits for renewable energy and farmland conservation to detract from one another, a balance may be achieved by appropiately scaling the size of projects to meet on-farm energy needs.
The following resource provides more information on agricultural applications for solar energy.
-
Solar applications on farms, Xiarchos & Vick (USDA), 2011
Renewable Energy Storage
A mere 20 days of sunshine matches all the energy stored in Earth’s coal, oil and natural gas reserves (UCS). What happens, though, when the sun isn’t shining? Furthermore, renewable energy sources can potentially generate enough of the overall power transmitted in an electrical grid to even surpass energy demand at times. Fortunately, new technologies integrated with “smart grid” management tactics enable renewable energy to be stored, so we can use it when we need it. This can eliminate many farmers’ uncertainty as to whether excess renewable energy generated onsite can be utilized.
California has its own mandate to develop renewable energy storage capabilities on an industrial scale that will also benefit consumers who feed renewable energy into the grid. In 2013, the California Public Utilities Commission (CPUC) approved regulations requiring investor-owned utilities such as Pacific Gas & Electric to invest in 1.3 GW of renewable energy storage capacity by the end of 2020. That storage could power roughly 1 million homes. The decision allows utilities to conduct cost/benefit analyses to determine appropraite storage technologies (Wisland 2013). Utilities can thus store and use excess renewable energy generated by residents, then pass savings onto them, by deploying only the most energy-efficient and affordable technologies.
Farmers could use their own excess renewable energy generated onsite if they install a storage system, generally consisting of a battery (such as lithium-ion or lead-acid) and a converter. Current systems are expensive, but the price is expected to fall as the solar PV market continues to grow. Though batteries will eventually need to be replaced, onsite storage enables an increase in “self-consumption”, or amount of onsite-generated electricity used vs. grid-supplied electricity (Renewable Energy World 2014).
The following resources provide more detailed information on renewable energy storage capabilities.
-
How is wind energy stored?, Kivi, date unknown
-
3 clever new ways to store solar energy, Krisch, 2014
-
The Role of Energy Storage with Renewable Electricity Generation, Denholm et al, 2010
-
Residential solar energy storage market could approach 1 GW by 2018, Renewable Energy World, 2014
-
California jumpstarts energy storage, Wisland, 2013
Bioenergy
Another form of energy provision is possible by utilizing farm waste. Anaerobic digesters are often used on dairy farms to capture methane and nitrous oxide emissions from cattle manure to create biogas, replacing fossil fuels in energy generation. Other sources, such as food waste from processing facilities, can be used as feedstock in anaerobic digestion, or in combination with manure in a similar process termed co-digestion. As a form of renewable energy, it can be used onsite and excess generated energy can feed into the grid, qualifying operators for net energy metering benefits with the utility. In addition, it qualifies for carbon offsets in a number of different carbon markets (see resources). Though Monterey County has minimal dairy operations in existence, biogas production facilities using low-moisture solid feedstock from food processing wastes could provide up to 8.5 megawattts equivalent (MWe) in electricity (CBC 2011).
In the four phase anaerobic digestion process, organic waste is heated and agitated in a sealed tank known as a digester or bioreactor. In the absence of oxygen, micro-organisms decompose organic waste, multiply, and produce biogas (Electrigaz 2012). In the first phase, known as hydrolysis, adding water to the organic wastes breaks down the chemical bonds in carbohydrates, fats, and proteins. This yields sugars, fatty acids, and amino acids. Acidogenic (fermentative) bacteria then convert these into carbon dioxide, hydrogen, ammonia, and organic acids in the stage known as acidogenesis. In the third stage, acetogenesis, acetogens (bacteria and archaea that generate acetate) produce mostly acetic acid and small amounts of carbon dioxide and hydrogen. In the last stage, methanogens (archaea that generate methane) convert the products of these stages into methane and carbon dioxide through a form of anaerobic respiration, known as methanogenesis (American Biogas Council website).
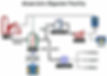
Schematic of anaerobic digestion, biogas recovery, and subsequent energy generation process. Source: Cornell University Small Farms Program
Biogas, containing approximately 60% methane and 40% carbon dioxide as well as trace amounts of other gases, is produced in the process and rises to the top of the digester from where it can be drawn out and stored in tanks. From there, biogas can power a combined heat and power facility, giving off electricity that can power the components of the farm or be sold to the grid, and heat that can be utilized on the farm and in the digester. Biogas can also be used as fuel for vehicles. In addition, it can feed into the gas grid to replace natural gas and reduce greenhouse gas emissions. The effluent that remains is low in odor and is nutrient-rich. Dried effluent can be used or sold as bedding, compost, and fertilizer (EPA Ag Star 2014).
Biogas has several environmental benefits. Even though combustion of biogas produces the greenhouse gas carbon dioxide, the carbon in biogas comes from plant matter that fixed carbon from atmospheric carbon dioxide [through photosynthesis]. So, biogas combustion is carbon-neutral, not adding to greenhouse gas emissions. Any replacement of fossil fuels by biogas lowers carbon dioxide emissions (Wilkie 2013). In contrast, natural gas is approximately 99% methane, which is a much more potent greenhouse gas than carbon dioxide, thereby having significantly more potential to contribute to global warming. By extracting methane out of the gas and using it for heat and electricity in a closed system, it does not degrade in an open environment, and therefore direct atmospheric emissions of methane are reduced (Electrigaz website). Biogas production can also reduce the pollution potential in wastewater by converting oxygen-demanding organic matter that could cause low oxygen levels in surface waters (Wilkie 2013).

Biogas production from anaerobic digestion process. Source: Clarke Energy, Biogas description, accessed 28 Jan 2015.
Suitability for installing an anaerobic digester and biogas capture facility depends on a variety of factors. Selected feedstock should be easily digestible, yielding large amounts of methane, and the digester must be able to handle the methane output (EPA Ag Star 2014). US EPA provides guidance on federal air quality regulations and for facilities in California. Permitting for some facilities can be subject to a range of air quality, solid waste, and water quality regulations, while other facilities may be exempt from one or more regulations, usually on the basis of capacity and anticipated use. Anaerobic digestion of compostable feedstock is subject to CalRecycle’s Compostable Materials Handling Operations and Facilities Requirements (Title 14 CCR). In addition, Rules 201, 207, and 218 of the Monterey Bay Unified Air Pollution Control District (MBUAPCD) provide guidance on local permitting requirements. Growers and shippers can also consider ways to link waste streams from their operations to fuel large-scale and high-efficiency digesters to reduce costs that could otherwise be spent less effectively on smaller scale and less efficient systems.
Though anaerobic digestion project operators cite the confusing regulatory structure as a major barrier to furthering adoption of this technology (CEC PIER 2006), local farmers provide some success stories. Recognizing the need to divert its waste stream, one onion grower farming in Monterey County built a processing facility in Ventura County that converts its onion waste into energy and generates 100% of its base-load electricity while saving the company $700,000 per year on electricity by extracting the juice out of their onion waste and letting it ferment in an anaerobic digester, which creates enough renewable biogas to power two on-site 300 kilowatt fuel cells—the equivalent of powering 460 homes in a year. The by-products are sold as cattle feed, generating additional revenue for the company (FuelCellEnergy 2013).
Between now and 2020, orchard and vine residues could generate 16-17% of Monterey County’s estimated 334,000-413,000MWh contribution from bio-wastes over that time (CEC PIER 2006: 109-115). Over 97% could come from grapes (CEC PIER 2006: 10-17), but it would rely on thermal conversion from biomass combustion occurring at waste to energy facilities, which do not exist in Monterey County

Vineyard prunings provide much of Monterey County's technical utilization potential of biomass for use in energy generation. Source: Machinery World Online, Feb 2014, Pruning--Easy and Safe, accessed 11 Feb 2015.
(CEC PIER 2006: 93). Currently, Monterey County’s biomass generation capacity is 5.2MWe from biochemical conversion processes. 1 MWe is from a wastewater treatment plant, and 4.2MWe from a landfill that converts gas to electricity (CEC PIER 2006: 124).
The following resources provide more information on the use of biomass for generating energy.
-
Anaerobic Digestion FAQs, US EPA Ag Star
-
Anaerobic Digester Status Report, US EPA, 2010
-
An Assessment of Biomass Resources in California, 2006, CEC PIER, 2006
-
Biogas information, University of Florida Extension
-
Carbon offset protocols for anaerobic digestion projects, US EPA
-
Permitting requirements overview, US EPA
-
Statewide anaerobic digestion resources, California Energy Commission
-
Waste-to-energy project in Oxnard, CA, FuelCellEnergy
Energy Audits
It is good to know how much energy you currently use, and what energy uses incur the most expenses, to be able to understand how to improve energy efficiency and save money. PG&E conducts farm energy audits for growers in its service area, including Monterey County. Their services are customized by type of agricultural operation. Their online case studies show how growers in California are saving money by saving energy. In addition, the company’s webpage offers energy-saving tips, energy-use calculators, and several other links to rebate programs offered at the state and federal level. Other companies specialize in energy use efficiency on farms in Monterey County and are able to establish use baselines, assist in developing monitoring plans, and help growers optimize their energy use, saving them money.
Money-back Solutions for Agriculture & Food Processing, PG&E
Climate Registry
One step in reducing emissions on farms is measuring the current level of greenhouse gas emissions from onsite management practices.
The Climate Registry is a nonprofit collaboration among North American states, provinces, territories and Native Sovereign Nations that sets consistent and transparent standards to calculate, verify and publicly report greenhouse gas emissions into a single registry. The registry supports both voluntary and mandatory reporting programs and provides comprehensive, accurate data to reduce greenhouse gas emissions. Several growers in Monterey County voluntarily report their emissions to help with this effort.
On-farm fuel efficiency & GPS applications
Some farm equipment is designed to reduce the number of passes tractors make through sets of field rows. For example, wider tractors and combines help to minimize fuel expenses, carbon emissions, and labor costs. These innovations have several applications in Monterey County agriculture. An implement for strawberries combines tillage, fertilizer applications and laying drip tape all in one pass. Another vegetable grower uses a multi-purpose implement that reduces passes three-fold and employs a secondary tillage system to dramatically reduce tillage costs and improve soil organic matter, seed bed finish and irrigation efficiency. This combination also optimizes crop planting windows due to reduced labor hours (Mitani 2014). A local vintner has been using wider spray booms that cover three rows compared to one previously. In addition, he is switching out tractors in the vineyard fleet for more fuel-efficient ones. He estimates that this combination of upgrades reduces his fuel costs 35% (Pomo 2014). Another vintner increased the density of his rows by placing vines closer together. This initially increased emissions due to taking more passes through the vineyard. However, after using wider multi-row spray booms and harvesters, emissions were reduced and efficiency soared (Mitchell 2014).
Precision agriculture practices further enable growers to increase yields while conserving natural resources. Using a combination of the Global Positioning System (GPS) and geographic information systems (GIS) proves especially useful for tractor guidance and variable rate applications, enabling growers to optimize applications of pesticides, herbicides and fertilizers. Many of the new innovations rely on the integration of on-board computers, data collection sensors, and GPS time and position reference systems. GPS enables farmers to accurately map field boundaries, road and irrigation systems, and to work during low-visibility conditions. GPS guidance systems automatically steer tractors to plow fields in straight lines with accuracy of two inches or less, allowing farmers to plant seeds, apply inputs and even optimize irrigation with similar precision. From 2007-2010, GPS agriculture practices accounted for almost $20 billion of crop production increases (nearly 12% of total U.S. crop production value), through higher yields and lower input costs (Pham 2011). A Monterey County fertilizer supplier was one the first to use GPS for applying fertilizer, optimizing labor


Above: Eliminator combines multiple agricultural operations. Source: Vogt, W., 28 Aug 2009, Company Fills California Equipment Niche, FarmProgress, Accessed 11 Feb 2015.
Below: Strawberry bed former prepares beds and lays drip tape simultaneously. Source: Veda Farming, Strawberry Bed Former, accessed 11 Feb 2015.
costs and input use efficiency. One vintner uses GPS to create maps that depict grape vigor across the vineyard, and then orients the vine rows to optimize the uniformity of sunlight exposure to them (Lipe 2014).
USDA NRCS has several links to help farmers estimate fuel use and potential savings from implementing a variety of practices the agency promotes. For instance, using mulch tillage instead of conventional tillage on 40 acres of lettuce in Salinas can reduce diesel costs 23% (USDA NRCS Energy Estimator 2015). The National Center for Appropriate Technology (NCAT) provides further energy efficiency recommendations in their report called, "Conserving Fuel on the Farm." Links to these resources are below.
-
Diesel savings from using conservation tillage, USDA NRCS Energy Estimator
-
Conserving Fuel on the Farm, Svejkovsky, NCAT, 2007
-
Economic benefits of commercial GPS use in the U.S., Pham, 2011
Energy and water system improvements in wineries
As the second largest energy consumer among food industries in California, local wineries have the opportunity to greatly improve their energy and water efficiencies. The Lawrence Berkeley National Laboratory and Fetzer Vineyards developed a self-assessment tool known as BEST Winery (Benchmarking and Energy and Water Savings Tool), that enables wineries to compare their energy and water efficiency to a best practice winery, accounting for differences in products sold and other winery characteristics. California winemaking consumes over 400 GWh of electricity annually-- the equivalent of powering almost 60,000 homes (CEC 2005; Fok 2008). The largest electricity uses in wineries are: refrigeration for cooling and cold storage; compressed air; and hot water (CEC 2005: 1).
Certifcation programs can assist in furthering energy conservation goals at many wineries and vineyards.
Under the Sustainability in Practice (SIP) certfication program, certified wineries and vineyards achieve and document all identified standards, plus they earn at least 75% of the available points in the section through implementing additional enhancements. In addition, an accredited 3rd party inspector audits the site's management practices and records. The standard for the energy conservation and efficiency chapter requires that all wells and pumps are tested for performance and documented each year. Management enhancements include things such as: improving pumping efficiency; making a plan that documents total fuel use; having a utility conduct an energy audit; using variable speed drives in irrigation pumps; reducing passes through the vineyard; and using renewable energy sources (SIP 2015).
The California Sustainable Winegrowing Alliance (CSWA) runs another certification program, known as the California Sustainable Winegrowing Program. This program is based on the idea of continual self-improvement. Requirements include: an annual self-assessment of CSWA-identified best practices and supporting evidence; meeting prerequisite criteria or having a plan in place to do so; demonstrating a process to identify sustainability issues onsite and solve them; demonstrated ability to maintain or improve scoring in categories of the assessment; and a demonstrated commitment to improvement over time. This model also uses a 3rd party audit, and CSWA is in the process of developing key sustainability performance indicators for viticulture based on groundwork laid by the Stewardship Index for Specialty Crops, which is still under development (CSWA 2015).
The following information includes a brief overview of some of the primary energy efficiency improvement methods available to wineries. The below resources provide more detailed information on improving energy efficiency in wineries through self-assessment and certification.
-
Benchmarking and Energy and Water Savings Tool for the Wine Industry, CEC, 2005
-
Energy Efficiency Opportunities in Wineries for Retrofit and New Construction Projects, BASE Energy Inc./San Francisco State University, 2013
Cogeneration, trigeneration, and absorption chillers in wineries
Using alternative methods of onsite power generation to upgrade refrigeration systems can help wineries achieve major energy savings and reduce emissions.
Cogeneration through combined heat and power (CHP) is the simultaneous production of electricity with the recovery and utilization of heat. It is a more efficient form of power generation and can be used onsite. It can reduce energy use 40% compared to using conventional electrical generators and onsite boilers, which use the most energy in wineries (Clarke Energy; CEC 2005: 41). This system is common among California wineries (CEC 2005: 18).
Trigeneration, or combined heat, power and cooling (CPHC), uses some of the heat produced in a cogeneration plant to generate chilled water for air conditioning or refrigeration through the use of an absorption chiller. It supplies energy in three forms: electricity, heat, and chilled water. Trigeneration also lowers electrical usage during peak summer demand, and any excess electricity can be fed into the grid. Using water as a refrigerant replaces the use of hyrdochlorofluorocarbons (HCFCs), which deplete ozone and have high global warming potential (Clarke Energy).
The below website provides more information on the benefits of using these power generation systems.
-
Trigeneration description, Clarke Energy

Schematics of improved energy-efficiency generation facilities.
Left: cogeneration.
Below: Tri-generation.
Source: Clarke Energy.

Cold stabilization vs. electrodialysis
Following fermentation, wine undergoes clarification in which clear wine is separated from spent yeasts and other solids. A traditional way to do this is racking, which siphons off the clear wine after the yeast and solids have settled to the bottom of the tank. Cold stabilization is commonly used to enhance this process. It allows wine to warm up to room temperature and then chills it down to below freezing. In this process, tartaric acid (occurring naturally in grapes) crystallizes and can be drawn off by racking. These crystals would otherwise end up in the bottom of wine bottles, and though safe, buyers often find them unacceptable (Fok 2008). However, cold stabilization can account for over 25% of total energy use in many wineries (CEC 2005).
An alternative to cold stabilization is electrodialysis. In electrodialysis, tartaric acid is removed as wine passes through an electric field that separates ions on anionic (negatively-charged) and cationic (positively-charged) membranes. The cationic membrane allows positively-charged calcium and potassium ions to pass through, while the anionic membrane allows negatively-charged tartaric acid ions to be removed. One chamber holds the wine, and a second chamber contains a solution of the extracted potassium and calcium ions. Water flows through the second chamber, creating a potassium and calcium brine (Fok 2008). Electrodialysis uses about 12% of the energy required in cold stabilization, because no freezing and reheating is required (Dahlberg 2004; Fetzer 2004; CEC 2005: 201-21), but it requires more water (Fok 2008).
Above: Electrodialysis operation schematic. Source: Virginia Tech Enology Grape Chemistry Group, Enology Notes, accessed 11 Feb 2015.
Below: Results of study comparing energy use of cold stabilization to that of electrodialysis. Electrodialysis consumes much less energy and reduces stabilization time required for wine. Source: Fok, S., Sep/Oct 2008, PG&E studies electrodialysis for cold stability, Practical Winery, accessed 11 Feb 2015.

Compressed air use in wineries and system improvements
Air compressors provide air conditioning, heat pumping, and refrigeration for wineries. The schematic below shows how a refrigeration system works to illuminate the role of an air compressor. Compressors in a refrigeration system compress the refrigerant. From there, the refrigerant moves through the condenser and heat is given off from vapor. Next, it passes into an expansion valve then through coils of an evaporator, where hot humid air from the ambient atmosphere is absorbed. Cool dry air releases into the ambient atmosphere to finish the cycle (Yeh 1998).

Schematic of refrigeration cycle. Source: Yeh, R., 1998, How a compression refrigeration system works, MIT website, accessed 3 Feb 2015.
Compressed air is likely the most expensive form of energy use in wineries due its poor energy efficiency. Its biggest use is generally from winepressing. Small and medium sized winery refrigeration compressors must be sized for the crush season following harvest, which only lasts 6-8 weeks. Hence, they are typically oversized and usually used only during this period (CEC 2005: 7, 13, 19). Compressed air in bottling can account for about 7% of a winery’s total electricity use. Many winemakers try to minimize the use of compressed air. Improving a compressed air system can save 20-50% or more of its associated electricity consumption (EP 2004).

Types of air compressors. Top: Reciprocating. Source: Integrated Publishing, Inc., Single-acting air compressor cylinder, accessed 11 Feb 2015; Middle: Rotary screw. Source: Proair Compressor Reviews, content uploads, accessed 11 Feb 2015; Bottom: Centrifugal. Source: IHS Engineering 360, Refrigeration compressors and air conditioning compressors information, accessed 11 Feb 2015.

Familiarity with different types of compressors can help winemakers increase energy efficiency by improving their system. Three basic compressor types exist: reciprocating, rotary screw, and centrifugal. Reciprocating compressors use a piston and a cylinder to provide compressive force, like combustion engines. They have a low initial cost and can produce very high pressures. However, they can be costly to maintain and should not be run continuously at full capacity. Rotary screw compressors compress the refrigerant between a pair of rotors. Up-front costs and maintenance are lower, and they produce high pressure using a small amount of gas. They do not last as long as other types. Centrifugal compressors use an impeller wheel to exert centrifugal force on refrigerant inside a round chamber. They efficiently compress large volumes of refrigerant to relatively low pressures, and they have a simple design (IHS 2014).
Controlling the speed of the compressor or system of compressors can improve efficiency. The easiest way to do this is to turn compressors on or off, and this can be done in reciprocating and rotary screw compressors. Another option is to combine different types of air compressors to meet the energy requirement of the operation (load) as it changes over time. This is done by base-loading (meeting the constant load portion) with rotary screw compressors, and trimming (meeting the additional varying portion) with reciprocating compressors (Petchers 2003: 602; CEC 2005: 22). Throttle controls can be used in centrifugal and screw compressors to vary the output of the compressor to match the air flow requirements for a specific operation. Compared to using a fixed speed compressor, an adjustable speed drive or variable frequency drive on a rotary screw compressor requires 40% less electrical power, can save 10% on refrigeration energy, and provides the same refrigeration capacity. Winemakers can also design master controls for the air compression system to respond to changes in pressure demand and shut down any inessential compressors (CEC 2005).
Changing the temperature or pressure of the air going into or coming out of the compressor, or utilizing the excess heat given off by the compressor’s operation can also improve efficiency. Reducing inlet air temperature to the compressor by taking suction from outside the building will save 1% compressor energy for every 5°F decrease (CADDET 1997; Parekh 2000). Minimizing discharge pressure at air compressor outlets can save 8% of the energy use. Air compressors convert as much as 80-93% of electrical energy they use into heat. Recovering that waste heat for water heating can save 20% of the energy used in compressed air systems annually (Radgen and Blaustein 2001).
Winery wastewater processing
Winemakers install wastewater treatment ponds to reduce the biological oxygen demand (BOD) and adjust the pH of the effluent from wineries. Microorganisms that decompose organic materials in wastewater consume oxygen in the process. That amount of oxygen is known as BOD. Oxygen in its dissolved state is measured as dissolved oxygen. If more oxygen is consumed than is produced, dissolved oxygen levels decline (US EPA 2012; APHA 1992). High BOD and low dissolved oxygen can be two indicators of poor water quality. Winery wastewater has a high BOD concentration from dissolved sugars, alcohol, and carbohydrates, in some cases as high as 20,000 parts per million (ppm). Water quality standards set by the Regional Water Quality Control Board (RWQCB) limit BOD to below 200 ppm and sometimes as low as 30ppm. Wastewater during crush at wineries is acidic, with a pH of 4.5, but the RWQCB standard for pH value ranges from 5-9 (ES; Wensloff 2014).
Newer treatment technologies are more efficient than traditional facultative ponds, due to higher efficiencies in reducing BOD and maintaining optimum dissolved oxygen levels. In facultative ponds, aeration is provided by floating aerators. The aerators mix oxygen from the air into the ponds’ water. These aerators are not very efficient, transferring about 3% of oxygen into the water. The top layer of a facultative pond is aerobic and the bottom depths are anaerobic. This design works well for sewage treatment, but not for wineries, since aerobic bacteria produced in BOD digestion can be beneficial to the soil as compost tea. Fine bubble diffusers are much more efficient. They use a rotary blower designed to deliver high volumes of air at low pressures. This air is delivered to the diffusers that produce tiny bubbles. The smaller the bubbles, the greater the oxygen transfers and energy efficiency. The fine bubble diffusers aerate the pond from the bottom to enlarge the anaerobic area, speeding up BOD digestion. One 10 horsepower (hp) blower can supply the same needs as five 1 hp floating aerators, reducing energy costs for the operation 80% (ES; Wensloff 2014).

Top: Facultative pond with aerobic and anaerobic action.
Bottom: Aerobic pond system uses rotary blower and fine bubble diffusers to increase the aerobic zone, enhancing energy-efficiency. Source: Wensloff 2014

As ponds take on more effluent, BOD and aeration required to lower the BOD increase proportionally (ES). Wineries have options to improve efficiency of the system to handle the effluent and reduce BOD.
One option is pH control. Changing the pH from about 4.0 to 7.0 will help microorganisms survive that reduce BOD. Sodium hydroxide, potassium hydroxide, and calcium hydroxide are added to increase pH, while phosphoric acid, citric acid, and sulfuric acid are added to lower it. Proportional feed pH control systems reduce the amount of time these compounds are fed into the wastewater proportionally as the sensor reading of the pH nears the desired pH (ES; Wensloff 2014; SBC Systems).
Maintaining a dissolved oxygen level at 2.0 ppm provides optimum BOD reduction. Having dissolved oxygen levels below 2.0 ppm results in smelly anaerobic conditions, and having them above 2.0ppm wastes electricity. Dissolved oxygen meters and variable frequency drives on aerators can optimize the levels (ES).
Bioreactors installed upstream of ponds can significantly reduce BOD using less space than putting in a new pond or expanding an existing one. In the reactor, effluent is highly aerated and the pH is adjusted, then the effluent flows into a clarifier where the bacteria settle out. The settled bacteria go back into the high BOD incoming stream, so the hungry bacteria can rapidly reduce BOD. The wastewater from bioreactors can be recovered as compost tea, an inoculant to spray on soils and vine foliage to increase fertility (ES).
New technology has been developed that enables anaerobic digestion of winery wastewater. This can remove polluting content in the high organic loads handled by bioreactors, but the variability in load and monitoring requirements throughout the year can make the system inefficient. Normally after anaerobic treatment in the reactor, aerobic treatment takes place to recover treated water (Oliveira and Duarte 2011).
Monterey County wineries have taken many steps to optimize the energy efficiency of their wastewater treatment systems. One vintner has a very efficient two pond and bioreactor system. First, a self-cleaning rotary screen filters out solids from effluent before it reaches the bioreactor. In the bioreactor, pH control is automatically controlled and recorded. Between the ponds is a series of clarifiers that allow bacteria to settle and be pumped back into the high BOD
Bioreactor schematic. Source: Wikimedia commons, accessed 5 Feb 2015.

influent of the first pond. This allows the bacteria level in the pond to concentrate further increasing BOD digestion rate. A 250 hp variable frequency drive (VFD) powers the rotary blowers and dissolved oxygen sensors to optimize aeration in the ponds. VFDs can run at different speeds to conserve energy, in this case based on the amount of wastewater that is processed (Mitchell 2015; ES; Wensloff 2014).

Aerobic digester and wastewater processing pond at a Monterey County vineyard. Source: Wensloff 2014
-
Bioreactors as a cost-effective solution to reclaim water, Wensloff, 2014
-
Bioreactor efficiency evaluations, Oliveira and Duarte, 2011
-
Dissolved oxygen and biochemical oxygen demand, US EPA, 2012/ APHA, 1992
-
Elutriate Systems (ES) website (winery wastewater services and information)
-
pH control system example, Santa Barbara Control (SBC) Systems
Greenhouse heating and cooling efficiency
Greenhouse operators can significantly reduce costs and optimize resources to benefit plant growth by upgrading the efficiency of heating and cooling features.
Automated curtains can control the daily amount of light and warmth orchids receive in many ways. They close to trap and conserve heat overnight. One local greenhouse utilizes five different curtain systems for this, using the amount of curtains to modulate the light and heat (Howell 2014). In another greenhouse, sensors respond to air temperature changes and signal a computer to open or close overhead vents accordingly, or to roll up one or both of two sets of aluminum-coated curtains. This provides passive heating and cooling as needed. The curtains retract from beneath the rafters to target temperature control to the lower level where the plants are housed. The aluminum coating reflects light away from plants, preventing temperature spikes when vents are closed. These not only help reduce energy costs, but also prevent plants from experiencing shock from abrupt temperature changes, promoting the plants' healthy development (Renteria 2014).
Another efficiency feature is using hot water to heat the greenhouse instead of air. A radiant heat system that utilizes hot water and heat capture provides higher efficiency heat than using a typical air duct system. This is because water conducts heat better than air. Hot water heating (hydronic) systems use boilers that quickly heat water, and the hot water is pumped out into tubes snaking beneath the floor to heat the greenhouse. Heating occurs through conductance (moving heat through objects that touch) and radiation (sending heat through empty space) of heat to the floor. The floor then radiates heat gained from the water into the room (HydronicHeating.net). The hot water is then returned to the boiler to make more efficient use of heat. The pipes are concave instead of convex (curving inward instead of outward), allowing the operator to use 70% less water to conduct and radiate the same amount of heat throughout the greenhouse. In addition, the installation of more piping than is standard can also reduce the water temperature, allowing for the incorporation of solar heating in the future (Howell 2014). This is because the closer the pipes are, the lower the average water temperature in them, and the higher the efficiency from the heat source (Bean 2006). A boiler can provide too much heat at times, leading to heat loss in the greenhouse, especially if it is the sole heat source. Using solar heating collectors as the primary heat source and using a boiler as a backup increases heating efficiency by reducing heat loss (Amann and Wilson 2008), and it produces more reasonable temperatures for plants. The condenser in the high-efficiency boiler preheats water with flue gas waste heat before reaching the boiler and irrigation water. In addition, greenhouse walls can be well-insulated with material such as 5-walled polycarbonate (Howell 2014).
Even though hydronic radiant systems cost more to install, they can be 30% more efficient than forced-air heating (D'Agnese 2012).
-
Greenhouse Energy Conservation Checklist, Extension.org, 2012

Top: System of curtains in greenhouse to modulate temperature. Source: Extension/FarmEnergy/SARE, 10 Jul 2012 (publ.), Greenhouse Thermal Shade Curtains, webinar, accessed from youtube.com, 11 Feb 2015. Bottom: Energy curtain in daytime operation. Source: Extension, 23 Mar 2012, Greenhouse Energy Conservation Checklist, accessed 11 Feb 2015.


Hydronic heating system with a boiler powered by a solar array. Source: Amann, J., and Wilson, A., Feb/Mar 2008, Home heating basics--an overview of options, HomePower.com, accessed 11 Feb 2015.
Energy efficiency incentives and rebates for Monterey County agriculture
Federal
Federal Business Investment Tax Credit (ITC) and Residential Renewable Energy Tax Credit
Investing in renewable energy projects (such as installing a solar project) can qualify businesses and residents for a tax credit of a portion of the cost of the system. Solar, fuel cells, and small wind projects qualify for a 30% credit, while geothermal, micro-turbines and cogeneration (CHP) qualify for a 10% credit.
Federal Modified Accelerated Cost-Recovery System (MACRS)
This is the U.S. tax depreciation system. It is used to recover the up-front costs of most tangible assets over time through annual tax deductions. The deducted amount depends on how long the asset takes to depreciate in value under the system. Many renewable energy projects fully depreciate under MACRS in five years, allowing for relatively quick cost-recovery. MACRS depreciates all of a business' qualifying assets (renewable energy projects), not just individual assets. If an applicant claims the Business ITC or Residential Renewable Energy Tax Credit, 85% of the cost is depreciable (recoverable through deductions). If not claiming one of those credits, the entire system cost is depreciable (SolarGaines 2014).
Renewable Energy Systems & Energy Efficiency Improvement Loans & Grants in California, USDA Rural Energy for America Program (REAP)
USDA announced in February 2015 that agricultural producers and small business owners can apply for resources to purchase and install renewable energy systems or make energy efficiency improvements. It is making $280 million available under the program which was approved in the 2014 Farm Bill with the aim to increase U.S. rural energy independence and as a result lower energy costs for agricultural producers and small businesses over time. Loans can cover up to 75% of the total eligible project costs (applicant covers the rest of the cost), grants can cover up to 25%, and a combination of loans and grants can cover up to 75%. Loans can be massive--from $5,000 up to $25 million. Grants for renewable energy systems range from $2,500-$500,000. Energy efficiency grants range from $1,500-$250,000. Businesses must be in a city or town with a population over 50,000. Agricultural producers can be in rural or non-rural areas.
State
CaliforniaFIRST is a program that levies a property tax increase on commercial buildings to fully finance (no up-front costs) energy efficiency and renewable energy projects for commercial building owners. The assessment increase is spread over a long period (up to 20 years), and energy savings are likely to more than recover the increase in property taxes. Projects in Monterey County can be eligible. The repayment obligation stays with the building if the property is sold, and payments and energy savings can be passed along to tenants. By having a tax lien, it does not hurt the credit of the building owners, allowing them to access third party financing for other improvements and it preserves the capital and credit line for core business investments. Projects start at $50,000.
Partial Sales and Use Tax Exemption for Agricultural Solar Power Facilities
Farmers can get a tax credit for the state sales tax portion on sales, storage, uses, other consumptions, or leases of farm equipment machinery primarily used for harvesting and production of agricultural products.
Property Tax Exclusion for Solar Energy Systems
Farmers installing qualified solar energy systems can receive property tax exclusions for the amount of the system. Qualified systems are active solar energy systems using solar devices that are "thermally isolated from the living space or any other area where the energy is used, to provide for the collection, storage, or distribution of energy" (California Revenue and Tax Code Section 73). Installation will not result in either an increase or decrease in the property’s assessed value since construction of an active solar energy system is a property tax exclusion, but not an exemption. This differs from normal construction, wherein what is added is considered new construction and is assessed at current market value, which is then added to the existing base year value for the property. Certain types of construction are excluded from this addition to the base year value through Proposition 7, approved in 1980 by California voters as an amendment to Section 2(c) of Article XIII A of the California Constitution. Even though they may increase the value of the property, the additional value is not assessable. People interested should contact the County Assessor for more information.
Local/Utility
Energy Watch, Association of Monterey Bay Area Governments (AMBAG) and PG&E
AMBAG and PG&E are promoting regional energy efficiency through this program in Monterey, San Benito, and Santa Cruz Counties. Program components include: energy assessments and audits; direct installation of energy efficient equipment; technical assistance and financial incentives for energy efficient retrofits in municipal buildings; energy efficiency seminars and training courses in the region; information on other PG&E energy efficiency programs and services; assistance accessing 0% or 3% financing for energy efficiency projects; developing Energy Action Strategies for jurisdictions; and compiling greenhouse gas inventories for jurisdictions.
Money Back Tool Rebates for Agricultural/Food Processing businesses, PG&E
PG&E’s Money Back tool lists all 70 rebates for energy system upgrades/projects/replacements that apply to agricultural and food processing businesses to help farmers recover money for energy improvements they make.
Non-Residential Energy Efficiency Financing Program, PG&E
Farmers can get 0% interest loans ranging from $5,000-$100,000 for replacing old and inefficient equipment. No up-front cost is required, and farmers have 5 years to repay the loan. Improvements can be for lighting, HVAC, electric motors, refrigeration, food service equipment and water pumps. Combined with other incentives (see website), this can wholly cover up-front costs energy efficiency upgrade projects.
Renewable Feed-in Tariffs (FITs), PG&E
Feed in tariffs, which offer long-term contracts to renewable energy producers based on the cost of generation of each technology, are available to energy producers of up to 3MW in capacity for generation in California under the statewide program known as Electric-Renewable Market Adjusting Tariff (E-ReMAT), provided they are strategically located. Through the tariff, the utility pays for every kWh generated over 10, 15, or 20 years (duration of contract). The California Public Utilities Commission (CPUC) adjusts the pay rate for each contract period to reflect the value of every kWh generated on a time-of-delivery basis, so if the price offered does not attract a large enough market, CPUC can raise it. If the price offered attracts too large a market, CPUC may lower the price paid to the generator. PG&E service area (includes Monterey County) is allocated 218.8MW capacity of the statewide total of 750 MW. These tariffs will soon also be available for bioenergy projects totaling an additional 250 MW. If the energy generation system is net metered, owners must stop net metering to receive FITs.
Self-Generation Incentive Program, PG&E
Business customers can receive financial incentives for installing new equipment for generating energy, such as wind, energy storage, waste to energy, biogas, fuel cells and combined heat and power. Incentives awarded are tiered based on use of renewable energy technologies and efficiency of renewables or non-renewables. Farmers could reduce project costs up to 60% using this incentive.
Conclusion
Given the rising cost of energy and the impact agriculture can have on climate change, many growers are concerned with conserving energy and interested in pursuing renewables. Wind remains the most technically efficient system for use in agriculture, but comes with constraints that should be addressed such as siting and impacts to wildlife. Solar energy, recently having become cost-competetive, is expected to rise in use, and agricultural applications are fertile soil for a range of solar technologies. Biomass provides addtional potential to power a wide range of farms and reduce greenhouse gas emissions in multiple ways. Vintners and winemakers have several resources to greatly enhance the efficiency of both water and energy uses in wineries and vineyards. We encourage Monterey County's agricultural community to venture towards installing smaller scale renewable energy projects that will help them meet their farm needs in addition to reducing energy costs, as well as to make renewed efforts into on-farm energy conservation through the use of effficient machines and aspects of conservation in agricultural practices. Finally, several resources are at the disposal of the agricultural community to assist in harvesting energy efficiency and renewable energy.
Bibliography
-
Alcock, D. and R. Hegarty, 2006, Effects of pasture improvement on productivity, gross margin and methane emissions of a grazing sheep enterprise, In: Greenhouse Gases and Animal Agriculture: An Update, C. Soliva, J. Takahashi, and M. Kreuzer (eds.), International Congress Series No. 1293, Elsevier, The Netherlands, pp. 103-106.
-
Amann, J., and Wilson, A., Feb/Mar 2008, Home heating basics--an overview of options, HomePower.com, accessed 11 Feb 2015.
-
American Public Health Association (APHA), 1992, Standard Methods for the Examination of Water and Wastewater, 18th ed., Washington D.C.
-
Base Energy Inc./San Francisco State University, 2013, Energy Efficiency Opportunities in Wineries for Retrofit and New Construction Projects, Industrial Energy Technology Conference, New Orleans, LA, May 21-24 2013, 12 pp.
-
Bean, R. (Ed.), 2006, Infloor Radiant Design Guide: Heat Loss to Head Loss, accessed 18 Feb 2015.
-
California Air Resources Board (CARB), California EPA, 24 Mar 2014, 2012 emissions, California Greenhouse Gas Inventory for 2000-2012—by IPCC Category, 33pp.
-
California Biomass Collaborative (CBC), May 2011, CBC Summary of Current Biomass Energy Resources for Power and Fuel in California, 20 pp.
-
California Energy Commission (CEC), 2014, Summary of Renewable Energy Installations Current and Planned in California (Revised December 31, 2014), accessed 9 Feb 2015.
-
California Sustainable Winegrowing Alliance (CSWA) website, accessed 18 Feb 2015.
-
Cardwell, D., 23 Nov 2014, "Solar and Wind Energy Start to Win on Price vs. Conventional Fuels", New York Times, accessed 17 Feb 2015.
-
CEC, Public Interest Energy Research (PIER) Program, 2006, An Assessment of Biomass Resources in California, Draft Report, prepared by California Biomass Collaborative.
-
—2006a, Anaerobic Digester Implementation Issues: Phase II—A Survey of California Famers, PIER Final Project Report, Prepared by Resource Strategies, Inc., 20pp.
-
—2005, Best Winery Guidebook: Benchmarking and Energy and Water Savings Tool for the Wine Industry, PIER Final Project Report, Prepared by Lawrence Berkeley National Laboratory, 69 pp.
-
Centre for the Analysis and Dissemination of Demonstrated Energy Technologies (CADDET), 1997, Saving Energy With Efficient Compressed Air Systems, Maxi Brochure 06 (cited in CEC 2005).
-
Clark, H., Pinares, C., and C. de Klein, 2005, Methane and nitrous oxide emissions from grazed grasslands, In: Grassland. A Global Resource, D. McGilloway (ed.), Wageningen Academic Publishers, Wageningen, The Netherlands, pp. 279-293.
-
Clarke Energy, Cogeneration and Trigenration webpages, Clarke Energy website, accessed 9 Dec 2014.
-
D'Agnese, J., 2012, Radiant Floor Heating, This Old House Magazine, accessed 17 Feb 2015.
-
Dalal, R., Wang, W., Robertson, G., and and W. Parton, 2003, "Nitrous oxide emission from Australian agricultural lands and mitigation options: a review", Australian Journal of Soil Research 41: 165-95.
-
Database of State Incentives for Renewables & Efficiency (DSIRE), 2014, California Incentives/Policies for Renewables & Efficiency, accessed 2 Feb 2015.
-
Denholm, P., Ela, E., Kirby, B., and Milligan, M., Jan 2010, The Role of Energy Storage with Renewable Electricity Generation, National Renewable Energy Laboratory, Technical Report NREL/TP-6A2-47187.
-
Dahlberg, E., 2004, Personal written communication with Eric Dahlberg of Wine Secrets, a manufacturer of electrodialysis equipment, 6 Dec 2004 (cited in CEC 2005).
-
Diekow, J., Mielniczuk, J., Knicker, J., Bayer, J., Dick, D., and I. Kögel-Knabner, 2005, "Soil C and N stocks as affected by cropping systems and nitrogen fertilization in a southern Brazil Acrisol managed under no-tillage for 17 years," Soil and Tillage Research 81: 87-95.
-
Efficiency Partnership (EP) 2004, Industrial Product Guide – Manufacturing and Processing Equipment: Compressed Air Equipment (cited in CEC 2005).
-
Electrigaz, Biogas FAQ, accessed 28 Jan 2015.
-
Elutriate Systems (ES) website, accessed 4 Feb 2015.
-
Fetzer, 2004, Personnal communication with various winemakers and operators on winemaking characteristics and energy use and savings (cited in CEC 2005).
-
Fitchette, T., 8 Jan 2015, "Paraiso Vineyards taps sun to make wine", Western Farm Press, accessed 18 Feb 2015.
-
Fok, S., 2008, PG&E Studies Electrodialysis for Cold Stability, Practical Winery & Vineyard Journal, Pacific Gas & Electric Co.
-
Freibauer, A., Rounsevell, M., Smith, P., and A. Verhagen, 2004, "Carbon sequestration in the agricultural soils of Europe," Geoderma 122: 1-23.
-
FuelCellEnergy, 2013, Gills Onions Case Study, accessed 29 Jan 2015.
-
Google, 2015, search result for average home energy use, “In 2012, the average annual electricity consumption for a U.S. residential utility customer was 10,837 kWh.”
-
GP Joule, 2014, Sophisticated Technology--Paraiso Vineyards Solar Park, accessed 18 Feb 2015.
-
Howell, D., 2014, personal communication.
-
HT Harvey & Associates, 15 Nov 2007, Presence and Movements of California Condors Near Proposed Wind Turbines, Final Report, Prepared by N. Thorngate, Ventana Wildlife Society, 21 pp.
-
IHS, 2014, Refrigeration Compressors and Air Conditioning Compressors Information, IHS Global Spec website, accessed 12 Dec 2014.
-
Intergovernmental Panel on Climate Change( IPCC), 2011, IPCC Special Report on Renewable Energy Sources and Climate Change Mitigation. Prepared by Working Group III of the IPCC [O. Edenhofer, R. Pichs-Madruga, Y. Sokona, K. Seyboth, P. Matschoss, S. Kadner, T. Zwickel, P. Eickemeier, G. Hansen, S. Schlömer, C. von Stechow (eds)]. Cambridge University Press, Cambridge, UK and New York, NY, USA, 1075 pp. (Chapters 7 & 9).
-
—2007, From: Chapter 8: Agriculture, In: Smith, P., Martino, D., Cai, Z., Gwary, D., Janzen, H., Kumar, P., McCarl, B., Ogle, S., O’Mara, F., Rice, C., Scholes, B., Sirotenko, O., 2007: Agriculture. In Climate Change 2007: Mitigation. Contribution of Working Group III to the Fourth Assessment Report of the Intergovernmental Panel on Climate Change [B. Metz, O.R. Davidson, P.R. Bosch, R. Dave, L.A. Meyer (eds)], Cambridge University Press, Cambridge, UK and New York, NY, USA.
-
Kivi, R., (unknown date) How is wind energy stored?, eHow, accessed 27 Jan 2015.
-
Koga, N., Sawamoto, T., and H. Tsuruta, 2006, "Life cycle inventory-based analysis of greenhouse gas emissions from arable land farming systems in Hokkaido, northern Japan", Soil Science and Plant Nutrition, 52: 564-74.
-
Krisch, J., 21 Jan 2014, 3 clever new ways to store solar energy, Popular Mechanics, accessed 27 Jan 2015.
-
Lal, R., 2003, "Global potential of soil carbon sequestration to mitigate the greenhouse effect," Critical Reviews in Plant Sciences 22: 151-84.
—2004: "Soil carbon sequestration impacts on global climate change and food security," Science 304:1623-27.
-
Leng, R., 1991, Improving Ruminant Production and Reducing Methane Emissions from Ruminants by Strategic Supplementation, EPA Report no. 400/1-91/004, Washington, D.C.
-
Leyde, T., 31 Jul 2014, “Wind turbine going up in Gonzales”, The Monterey Herald.
-
Lipe, B., 2014, personal communication.
-
Marland, G., West, T., Schlamadinger, B., and L. Canella, 2003, "Managing soil organic carbon in agriculture: the net effect on greenhouse gas emissions", Tellus 55B: 613-21.
-
McCrabb, G., Kurihara, M., and R. Hunter, 1998, "The effect of finishing strategy of lifetime methane production for beef cattle in northern Australia", Proceedings of the Nutrition Society of Australia 22, 55 pp.
-
Miller, G., 2014, personal communication.
-
Mitani, M., personal communication.
-
Mitchell, A., 2014, personal communication.
-
—2015, personal communication.
-
Oliveira, M., and E. Duarte, 2011, Winery Wastewater Treatment - Evaluation of the Air MicroBubble Bioreactor Performance, In: Mass Transfer - Advanced Aspects, H. Nakajima (Ed.), InTech, accessed 4 Feb 2015.
-
Parekh, P., 2000, Investment Grade Compressed Air System Audit, Analysis and Upgrade, In: Twenty-second National Industrial Energy Technology Conference Proceedings, Houston, TX, Apr 5-6: 270-79.
-
Paustian, K., Babcock, B., Hatfield, K., Lal, R., McCarl, B., McLaughlin, S., Mosier, A., Rice, C., Robertson, G., Rosenberg, N., Rosenzweig, C., Schlesinger, W., and D. Zilberman, 2004, Agricultural Mitigation of Greenhouse Gases: Science and Policy Options, CAST (Council on Agricultural Science and Technology) Report, R141 2004, 120 pp.
-
Petchers, N., 2003, Combined Heating, Cooling, and Power Handbook: Technologies & Applications: an Integrated Approach to Energy Resource Optimization, the Fairmont Press, Inc., Google eBook, 875 pp.
-
Pham, N., 2011, The economic benefits of commercial GPS use in the U.S. and the costs of potential disruption, NDP Consulting.
-
Radgen, P., and E. Blaustein (Eds.), 2001, Compressed Air Systems in the European Union, Energy, Emissions, Savings Potential and Policy Actions, Germany.
-
Renewable Energy World, 12 Nov 2014, Residential solar energy storage market could approach 1 GW by 2018, accessed 27 Jan 2015.
-
Renteria, J., 2014, personal communication.
-
Robertson, G., 2004, Abatement of nitrous oxide, methane and other non-CO2 greenhouse gases: the need for a systems approach, In: The global carbon cycle. Integrating Humans, Climate, and the Natural World, C. Field, and M. Raupach (eds.), SCOPE 62, Island Press, Washington D.C.: 493-506.
-
Santa Barbara Control Systems (SBC), Chemtrol 240 Digital pH Controller brochure, accessed 4 Feb 2015.
-
Sisti, C., Santos, H., Kohhann, R., Alves, B., Urquiaga, S., and R. Boddey, 2004, "Change in carbon and nitrogen stocks in soil under 13 years of conventional or zero tillage in southern Brazil," Soil and Tillage Research 76: 39-58.
-
Smith, P., 2004, "Carbon sequestration in croplands: the potential in Europe and the global context," European Journal of Agronomy 20: 229-36.
-
—2004a, Engineered biological sinks on land, In: The Global Carbon Cycle: Integrating humans, climate, and the natural world, C. Field and M. Raupach (eds.). SCOPE 62, Island Press, Washington D.C.: 479-91.
-
Solarbuzz, 2010, Comprehensive Solar Industry Trends and Analysis, Report, Solarbuzz website, accessed 12 Jul 2010 (cited in Xiarchos and Vick, USDA 2011).
-
—2010a, Cost Competitiveness, Solar Energy Markets and Growth, Solarbuzz website, accessed 12 Jul 2010 (cited in Xiarchos and Vick, USDA 2011).
-
SolarGaines, LLC., 9 Sep 2014, How to depreciate your commercial solar investment with MACRS, accessed 6 Feb 2015.
-
Soussana, J.-F., Loiseau, P., Viuchard, N., Ceschia, E., Balesdent, J., Chevallier, T., and D. Arrouays, 2004, "Carbon cycling and sequestration opportunities in temperate grasslands", Soil Use and Management 20: 219-30.
-
Sustainability in Practice SIP Certified website, accessed 18 Feb 2015.
-
Title 14 CCR, Division 7, Chapter 3.1: Compostable Materials Handling Operations and Facilities Regulatory Requirements.
-
Union of Concerned Scientists (UCS), How solar energy works, accessed 26 Jan 2015.
-
—2003, Farming the Wind: Wind Power and Agriculture, accessed 9 Feb 2015.
-
US Department of Energy (DOE), 2015, Advantages and Challenges of Wind Energy, accessed 9 Feb 2015.
-
—2012, Wind Program Accomplishments, US DOE Energy Efficiency and Renewable Energy.
-
US Envrionmental Protection Agency (EPA), 2012, Dissovled Oxygen and Biochemical Oxygen Demand, accessed 4 Feb 2015.
-
US EPA Ag Star, 2014, Anaerobic Digestion FAQs, accessed 27 Jan 2015.
-
Vedafarming, Reverse Tiller, Vedafarming website, accessed 6 Feb 2015.
-
Wensloff, G., Elutraite Systems, 2014, Bioreactors as a Cost Effective Solution to Reclaim Water, Sustainable Ag Expo 2014, accessed 4 Feb 2015.
-
West, T., and W. Post, 2002, "Soil organic carbon sequestration rates by tillage and crop rotation: A global data analysis," Soil Science Society of America Journal 66: 1930-46.
-
Wilkie, A., 2013, Biogas: a renewable biofuel, Institute of Food and Agricultural Sciences, University of Florida Extension, accessed 27 Jan 2015.
-
Wisland, L., 18 Oct 2013, California jumpstarts energy storage, Union of Concerned Scientists, accessed 26 Jan 2015.
-
Xiarchos, I., and B. Vick, USDA, Apr 2011, Solar Energy Use in U.S. Agriculture Overview and Policy Issues, USDA Office of the Chief Economist, Office of Energy Policy and New Uses, 86 pp.
-
Yeh, R., Massachusetts Institute of Technologoy (MIT), 1998, Compression Refrigeration System, accessed 14 Jan 2015.
Veda Farming
Extension